

Welcome, fellow creatures of the radiology night. Tonight’s curiosity is a small, elegant rabbit study that did something I find deeply satisfying: it took two entirely different contrast agents, sent them through the same lungs at the same time, and sorted them back apart afterward — by counting the energy of individual photons. A compulsion after my own heart.
Key takeaways
- A preclinical study on a spectral photon-counting CT (SPCCT) prototype separated inhaled xenon gas and injected gadolinium contrast into simultaneous lung ventilation and perfusion maps in a single scan [1].
- The xenon-based ventilation maps correlated strongly (pooled Pearson r = 0.88, R² = 0.78) with an established specific-ventilation measure, in five rabbits [1].
- The gadolinium-based perfusion maps showed a statistically significant dorsal-to-ventral gradient, consistent with gravity-dependent blood pooling under anesthesia [1].
- This is phantom-and-animal feasibility work, not a clinical test — the scanner is a research prototype, and two co-authors are Philips Healthcare employees [1].
What a K-edge actually is
Every element absorbs X-rays with a characteristic signature. As photon energy increases, absorption generally decreases smoothly — until it hits the binding energy of that element’s innermost (K-shell) electrons. At that precise energy, absorption jumps sharply upward, then resumes its decline. That jump is the K-edge: a spectral fingerprint unique to each element [1].
Conventional CT detectors integrate all photon energies into a single brightness value per pixel, discarding exactly the information a K-edge lives in. Photon-counting detectors do the opposite: they register each individual X-ray photon and sort it into an energy bin. That is the entire trick. If you can resolve energy, you can see a K-edge. If you can see multiple K-edges at once, you can, in principle, tell multiple contrast agents apart in a single acquisition — a capability color K-edge material decomposition turns into separate images, one per material.
I have spent four centuries counting things I did not choose to count. Watching a detector count photons “by energy”, on purpose, to distinguish one element from another — well, dear reader, it is the closest thing I have to a hobby.
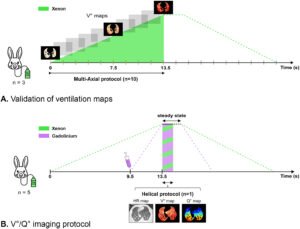
A schematic representation of the imaging protocol.
Two tracers, one acquisition: the study design
A French-Italian-German research team used a clinical SPCCT prototype to test whether xenon gas (inhaled, for ventilation) and a gadolinium-based agent (injected intravenously, for perfusion) could be imaged together and separated by color K-edge decomposition, rather than in two separate passes [1].
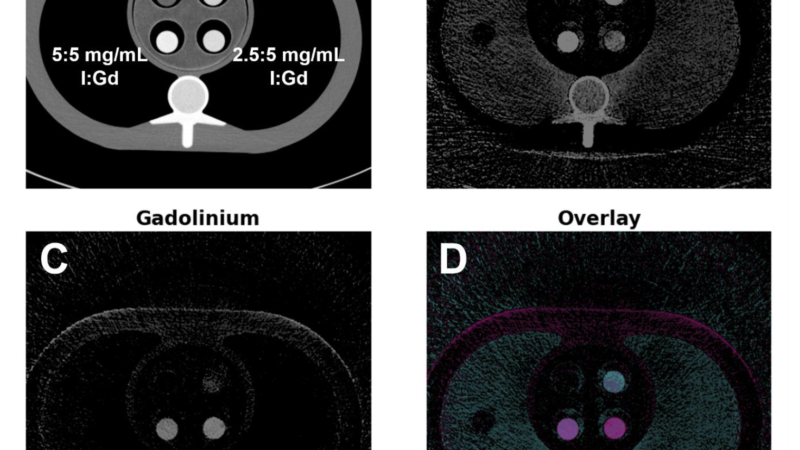
The work had two arms. A benchtop phantom experiment tested whether gadolinium concentrations could be accurately quantified and whether the xenon and gadolinium signal channels cross-contaminated each other. An in vivo arm imaged five mechanically ventilated New Zealand white rabbits (mean weight 2.9 ± 0.06 kg) breathing xenon gas while receiving an intravenous gadolinium-based ultrasmall rigid platform (USRP) agent, a research contrast formulation distinct from standard clinical gadolinium agents [1]. Two co-authors, Klaus Erhard and Maria Nicole Antonuccio, are Philips Healthcare employees — Philips being the manufacturer associated with the SPCCT prototype used, a disclosed competing interest in the paper itself [1].
What the maps showed
In the phantom arm, measured gadolinium concentrations matched prepared concentrations with a perfect linear correlation (R² = 1), indicating accurate quantification and low cross-contamination between the two contrast channels [1].
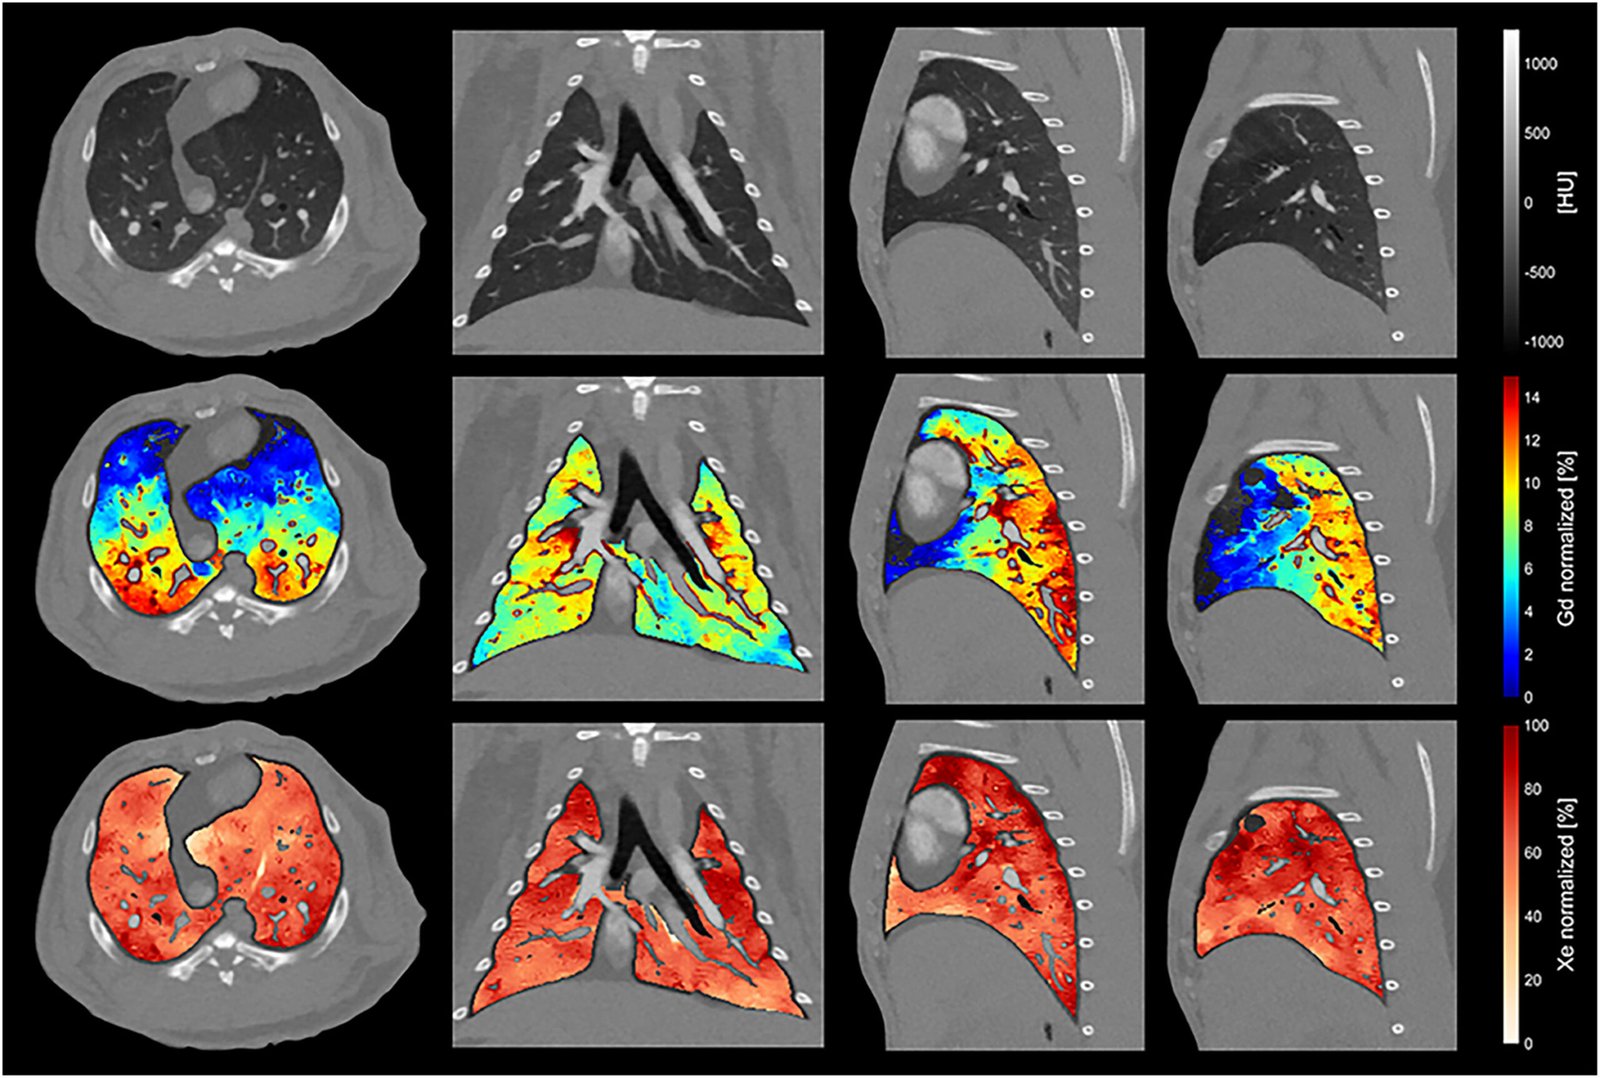
In the rabbits, normalized steady-state xenon maps correlated strongly with an established dynamic specific-ventilation metric — pooled Pearson r = 0.88, pooled R² = 0.78 across the five animals [1]. Xenon-based ventilation was distributed fairly homogeneously across the lungs (median 60.2%, Q1 59.3%, Q3 67.9%), with no statistically significant regional differences detected [1].
The gadolinium-based perfusion maps told a different, physiologically expected story: a statistically significant dorsal-to-ventral gradient (P < 0.05), with median values rising from 0.2% ventrally to 6.9% dorsally — consistent with gravity-dependent blood pooling in anesthetized, supine animals [1].
Two contrast agents, two distinct physiological signals, one scan.
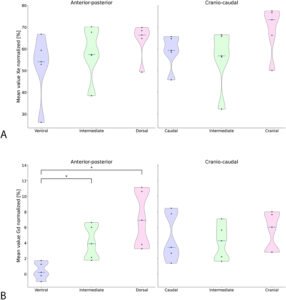
No statistically significant differences were observed between lung regions for the normalized xenon maps.
What this study does not show — yet
This is a five-animal, healthy-lung, phantom-plus-preclinical feasibility study and nothing more.
Worth stating plainly:
- All five rabbits were healthy. Nothing here speaks to obstructive, restrictive, vascular, or fibrotic lung disease.
- The scanner is a research-grade clinical prototype, not a commercially deployed system available to hospitals generally.
- There was no comparison to standard-of-care functional lung imaging — no V/Q scintigraphy, no hyperpolarized-gas MRI in the same animals. The xenon maps were validated against another CT-derived metric, not an independent reference-standard modality [1].
- Practical questions — radiation dose, xenon’s known physiological effects, workflow feasibility outside sedated animals — are not addressed in the available abstract.
Why photon-counting makes this distinctive
The interesting part, for those of us who think about detectors rather than diagnoses, is how this was done.
Prior work has separately demonstrated xenon-based ventilation imaging and gadolinium K-edge perfusion imaging, including on earlier dual-energy and dual-layer CT systems — but those approaches typically relied on indirect, two-step segmentation workarounds. This study instead used genuine multi-energy-bin, three-material decomposition made possible by true photon counting [1].
FAQ
What is a K-edge in X-ray imaging?
A K-edge is a sharp increase in how strongly an element absorbs X-rays, occurring at an energy specific to that element’s atomic structure. Photon-counting detectors can detect this jump because they measure individual photon energies rather than a single blended signal [1].
How does photon-counting CT separate two contrast agents in one scan?
Because different elements — here, xenon and gadolinium — have K-edges at different energies, sorting detected photons by energy bin lets software mathematically decompose the combined signal into separate maps, one per material [1].
Has this dual-contrast ventilation-perfusion technique been tested in humans?
No. This study imaged a benchtop phantom and five healthy rabbits on a research prototype scanner. No human data exist yet for this specific combined technique [1].
Does this replace or outperform nuclear medicine V/Q scanning or hyperpolarized-gas MRI?
That comparison was not made in this study. The xenon maps were validated against another CT-based ventilation metric, not against an independent reference-standard modality [1].
References
1. Robert A, Poletto S, Erhard K, et al. Simultaneous pulmonary ventilation and perfusion imaging using spectral photon counting CT with xenon and gadolinium-based agents in combination with color K-edge imaging. Diagn Interv Imaging. 2026 Jun 24. doi:10.1016/j.diii.2026.06.003

That, dear colleagues, is tonight’s curiosity: not a new clinical test, but a tidy proof that when you count photons carefully enough, you can ask a scanner to tell two different elements apart in the same breath — quite literally. I shall keep counting, and keep you posted when this idea meets its first human lung.
If tonight’s curiosity was your kind of nightlight, join the newsletter — one evening a week, no garlic required.
Educational content, not medical advice. Count Photon explains imaging technology and published research for educational purposes. Nothing here is medical advice, and it should never replace a conversation with a qualified healthcare professional about your own care.