
Figure:
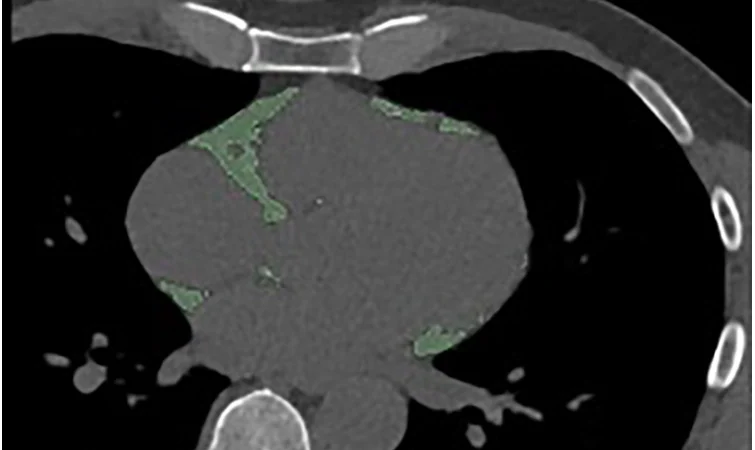
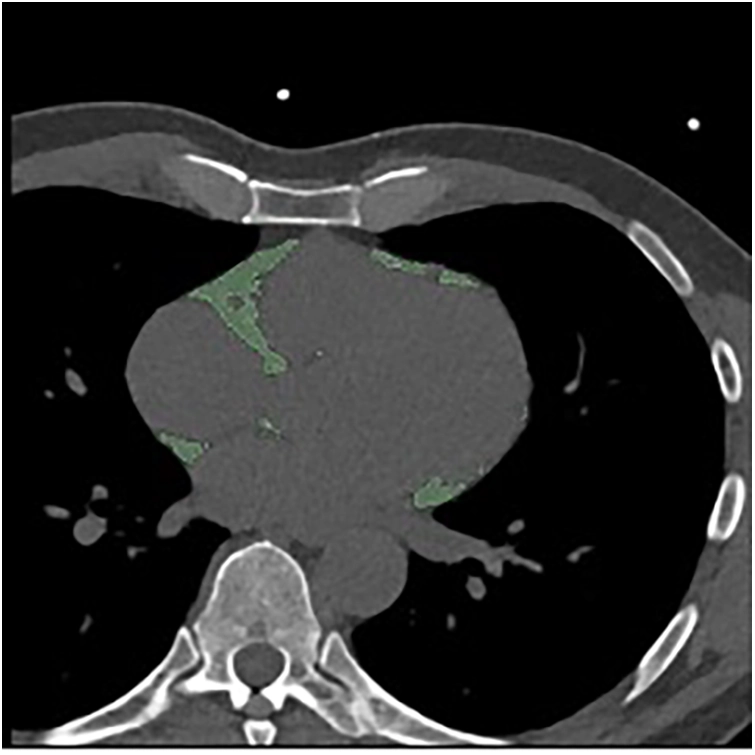
Example CT segmentation of a 69-year-old male patient with epicardial adipose tissue highlighted in green. https://www.frontiersin.org/journals/cardiovascular-medicine/articles/10.3389/fcvm.2026.1865937/full

Welcome, fellow creatures of the radiology night. Tonight’s subject is fat, specifically the fat that drapes itself around your heart, and what photon-counting CT (PCCT) can and cannot yet tell us about it.
Key takeaways
- A single-center study of 114 patients found a small but statistically significant difference in epicardial fat density and volume between those with and without hypertension, measured on PCCT [1].
- A radiomics-based machine-learning classifier built from over 1,000 fat-tissue features managed only modest discrimination (cross-validated AUC 0.65, held-out AUC 0.59) [1].
- None of the 1,015 individual radiomic features stayed significant after the researchers corrected for testing that many features at once [1].
- The authors describe the findings as exploratory and hypothesis-generating.
What the Mannheim group measured
Researchers at University Medical Center Mannheim scanned 114 patients on a first-generation dual-source PCCT system, the Siemens Healthineers NAEOTOM Alpha [1]. All had a coronary calcium score of zero and no visible stenosis, which isolates the fat signal from confounding coronary disease. Fifty-five had arterial hypertension; fifty-nine did not.
From the epicardial adipose tissue (EAT), the fat depot sitting between the heart muscle and the pericardium, the team extracted 1,015 radiomic features using PyRadiomics: first-order texture, shape, gray-level co-occurrence patterns, wavelet-filtered variants, the full menu. Three machine-learning classifiers were trained and tested on a held-out set.
The findings
Radiomics aside, the simplest measurements told the clearest story. Mean EAT attenuation was lower in the hypertension group: −80.31 HU versus −77.56 HU (p=0.036 in the Results, restated as p=0.033 in the Discussion) [1]. EAT volume was larger in the hypertension group: 95.78 cm³ versus 77.40 cm³ (p=0.047) [1].
Both differences are real, in the statistical sense, and both are small. Fat that is less dense and more voluminous in people with hypertension fits a plausible biological story about metabolically active fat.
Radiomics
Here is where I raise an eyebrow, and I have had four centuries of practice at it.
Of the 1,015 radiomic features tested, 148 looked nominally significant before correction. After the researchers applied the Benjamini-Hochberg correction for multiple comparisons, standard practice when testing over a thousand features at once, not one survived. The smallest adjusted p-value was 0.30 [1].
The team then adjusted for age, sex, and diabetes in a multivariable model. Fifty-five features were nominally associated with hypertension. After correction, again, none survived; the smallest adjusted p-value was 0.75 [1].
The classifiers built from these features performed accordingly. Logistic regression reached a cross-validated AUC of 0.65 (95% CI 0.61–0.68) and dropped to 0.59 (95% CI 0.36–0.75) on the held-out test set. Random forest and SVM landed near 0.61 [1]. An AUC of 0.5 is a coin flip.
A reproducible pipeline
One genuinely strong result deserves mention: the radiomics extraction itself was highly reproducible. The median intraclass correlation coefficient was 1.00, with 99.1% of features showing ICC of 0.90 or higher [1]. Whatever the biological signal turns out to be, the measurement machinery is not the weak link.
The hypertension and non-hypertension groups differed significantly at baseline in diabetes prevalence (16.3% vs. 1.7%, p=0.007), age (p=0.029), and sex distribution (p=0.032) [1]. The authors state plainly that their sample was too small to fully adjust for this. Some portion of the observed fat differences could reflect these imbalances rather than hypertension itself.
The broader picture
The paper places its own results in context by citing a separate multicenter EAT-radiomics study targeting myocardial ischemia, which reported AUCs of 0.84 in training and external validation [1]. That comparison matters: it shows radiomics performance on PCCT is highly dependent on the clinical endpoint and cohort, not a fixed property of the technology. This hypertension signal sits well below that bar, and this study is an incremental entry in an ongoing Mannheim-group research program on PCCT radiomics of cardiac fat.
What this means for imaging professionals
PCCT’s spectral and tissue-characterization capabilities clearly let researchers detect subtle attenuation and volume differences in fat tissue that conventional analysis might miss. But detecting a small, statistically significant group difference is not the same as building a usable biomarker.
Nothing here supports using PCCT-based fat radiomics to diagnose or predict hypertension in a patient, yet. No individual feature survived correction. There is no external validation cohort yet, and no outcome data linking this signal to actual cardiovascular events. The right way to read this study is as one more careful, well-documented data point in a young research line, worth watching.
Frequently asked questions
What is epicardial adipose tissue, and why do researchers care about it?
Epicardial adipose tissue is the fat depot between the heart muscle and the pericardium. It is metabolically active and has been associated with cardiovascular risk in prior research, which is why quantifying it on CT interests cardiovascular imaging researchers.
What is radiomics?
Radiomics extracts large numbers of quantitative texture, shape, and intensity features from medical images, then analyzes them statistically or with machine learning, looking for patterns beyond what the eye can see.
Does this study show PCCT can predict who has hypertension?
No. The classifier built from radiomic features performed only modestly better than chance (AUC 0.59–0.65), and the authors describe the findings as exploratory, not diagnostic.
Why did none of the 1,015 radiomic features remain significant?
When you test over a thousand features at once, some will look significant by chance alone. Correcting for multiple comparisons, as this team did, removes those false positives. None of the features survived that correction here.
What would need to happen before this becomes clinically relevant?
The authors call for larger, prospective, multicenter validation with balanced comorbidity profiles between groups, plus links to actual clinical outcomes rather than cross-sectional group differences.

Until that work exists, I will do what a four-hundred-year-old creature does best with early data: wait…
Stay curious, and keep your photons well counted.
Want the next study before it hits the feed? Join the Count Photon newsletter for imaging professionals who like their evidence hedged correctly.
Educational content, not medical advice. Count Photon explains imaging technology and published research for educational purposes. Nothing here is medical advice, and it should never replace a conversation with a qualified healthcare professional about your own care.
References
1. Waßmer F, Barz J, Nörenberg D, Schoenberg SO, Hertel A, Ayx I. Analysis of epicardial adipose tissue in relation to arterial hypertension using radiomics in photon-counting CT. Front Cardiovasc Med. 2026;13:1865937.