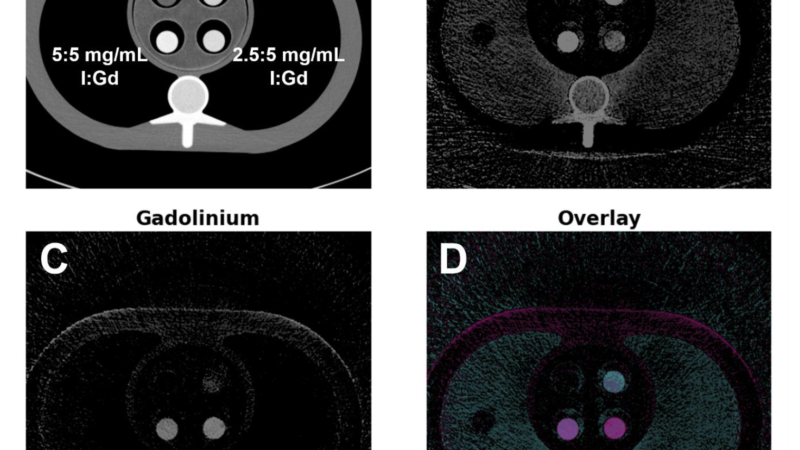

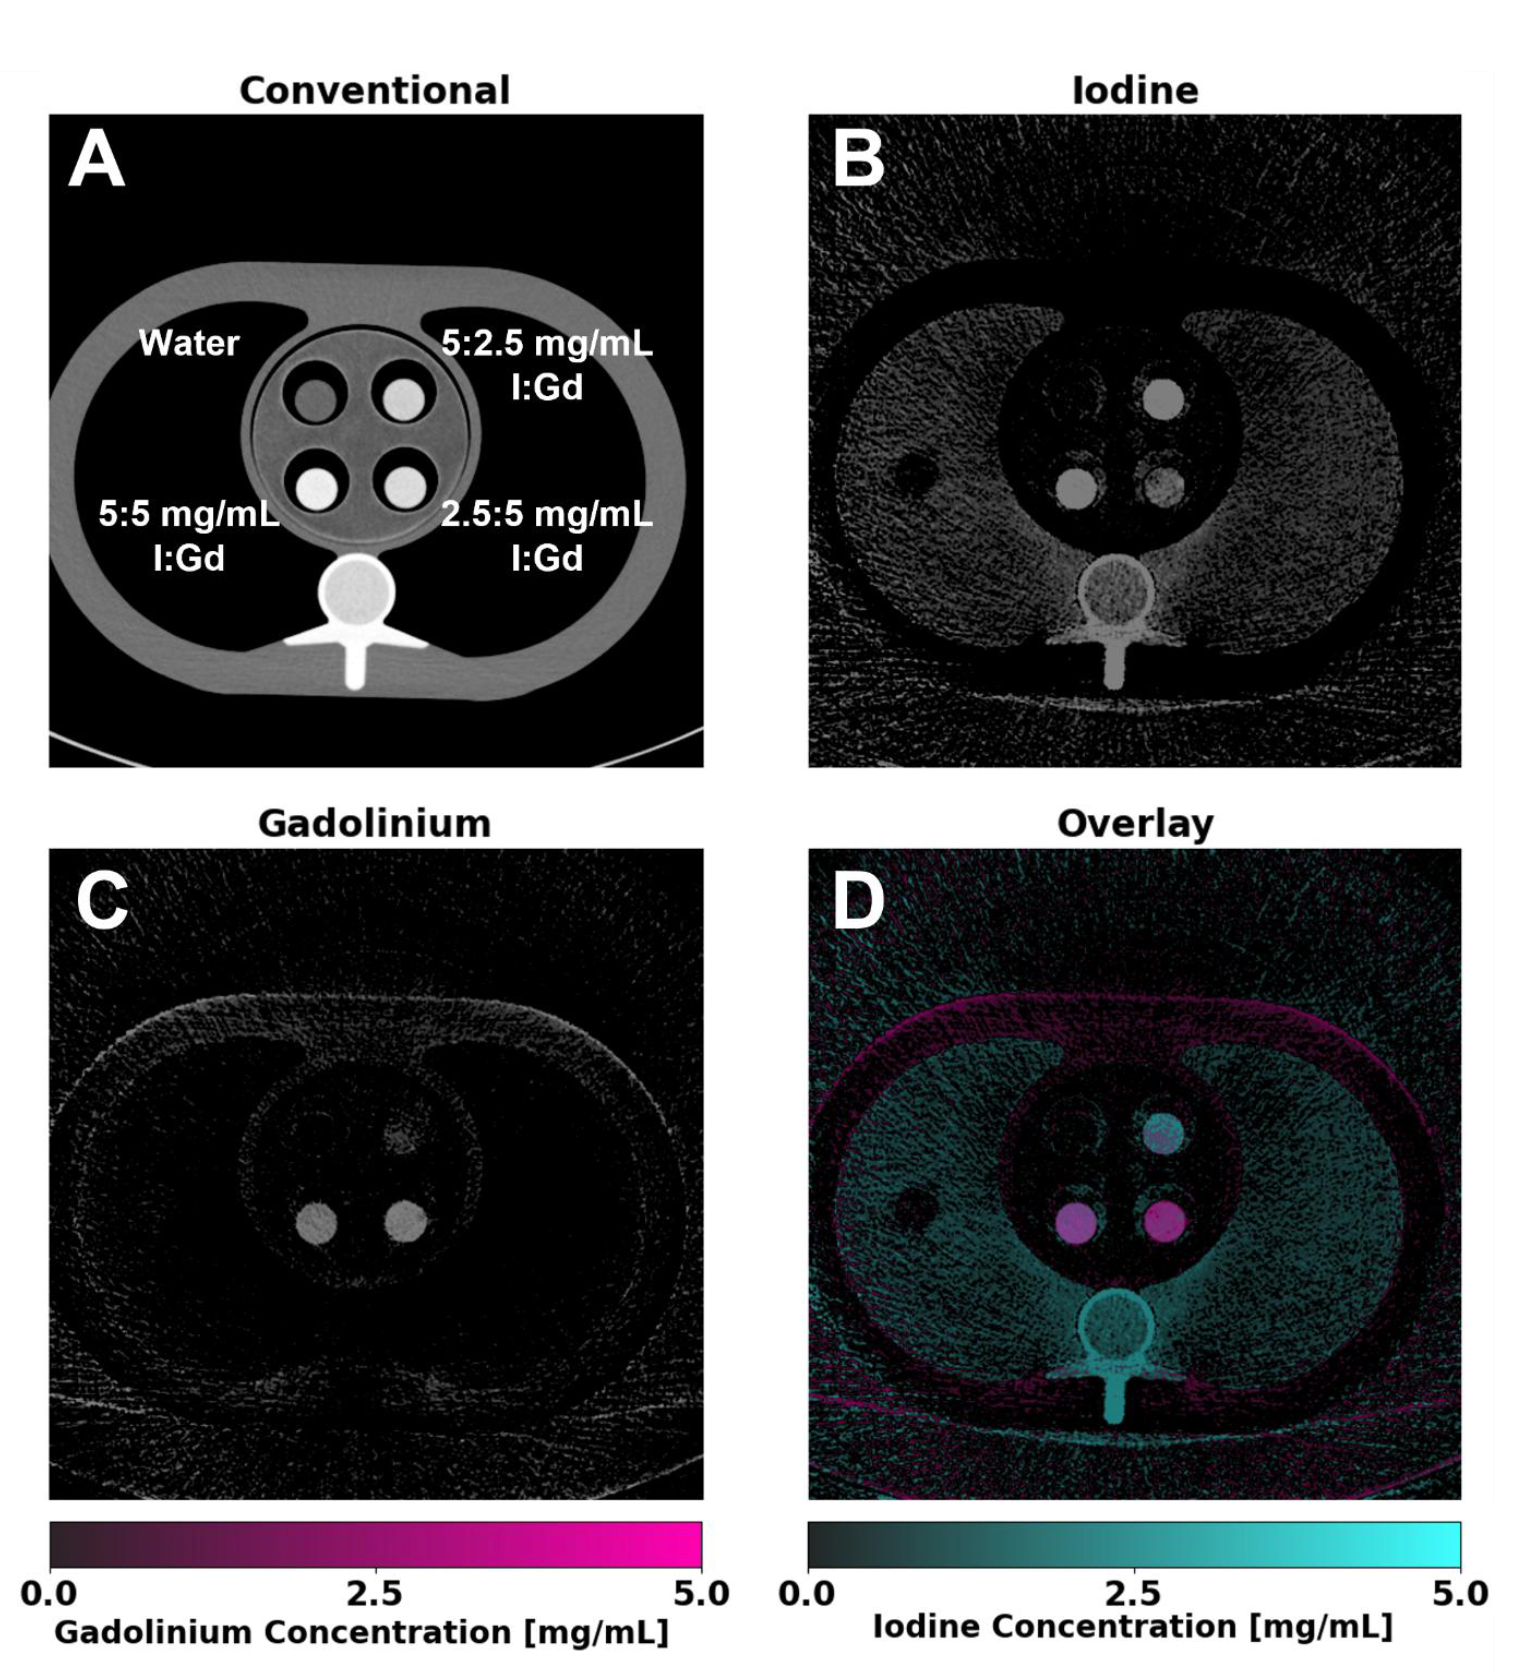
Figure 2:
Material-specific images of gadolinium and iodine using K-edge imaging.
Inserts containing varying concentrations of I and Gd were placed within a thoracic
phantom and scanned. Conventional images (A) display a standard grayscale CT
attenuation image (WL/WW: 200/600 HU), illustrating the inability to separate the two
contrast agents. Iodine maps (B) (WL/WW: 2.5/5 mg/mL) show successful localization of
iodine within inserts, with gadolinium maps (C) (WL/WW: 2.5/5 mg/mL) also achieving
successful separation of gadolinium and iodine within the same volume. An overlay image
(D) highlights the spatial distribution of both contrast agents, enabling enhanced
visualization of co-localized and distinct regions of each contrast agent.

Welcome, fellow creatures of the radiology night. Tonight’s specimen is not a patient, not even an animal, but a row of syringes: iodine and gadolinium contrast solutions, sitting inside a plastic thorax, waiting to be told apart by the one thing that makes each element chemically honest, its K-edge.
Key takeaways
- A new preprint tested K-edge material decomposition on a commercial dual-source photon-counting CT (PCCT) scanner, separating iodine and gadolinium solutions inside a thoracic phantom [1].
- Quantification bias fell as radiation dose and contrast concentration increased, and separating the two agents was harder when they were mixed together than when scanned alone [1].
- The results are consistent with earlier K-edge work on prototype PCCT systems, now shown on a scanner already sold for clinical use, though not yet tested in clinical use itself [1].
What a K-edge actually measures
Every element absorbs X-rays more strongly once photon energy crosses the binding energy of its innermost, or K-shell, electrons. Below that energy the electrons cannot be ejected by absorption; above it, they can, and absorption jumps sharply. That jump, the K-edge, sits at a different energy for every element: about 33 keV for iodine, about 50 keV for gadolinium.
Photon-counting CT (PCCT) detectors register the energy of each individual X-ray photon rather than only their combined intensity. Sort enough photons by energy on either side of two different K-edges, and a scanner can in principle tell iodine from gadolinium apart even when both sit in the same voxel, a task conventional CT and most dual-energy CT (DECT) protocols handle only approximately.
Phantom work
The team, based at the University of Pennsylvania, scanned syringes of iodine (Isovue-300) and gadolinium (Dotarem) at four concentrations, 1, 2.5, 5, and 10 mg/mL, both pure and mixed in six ratios, inside a QRM Thorax phantom [1]. The scanner was a clinical dual-source PCCT system, the Siemens Healthineers NAEOTOM Alpha, run at 140 kVp with four energy thresholds and four radiation dose levels from 1 to 8 mGy CTDIvol [1].
Material separation used an existing, Siemens-affiliated image-domain decomposition algorithm published in 2024, evaluated with Bland-Altman bias analysis and contrast-to-noise ratio (CNR), and tested with Bonferroni-corrected statistics [1].
What the numbers showed
Across every concentration, dose, and solution type tested, the scanner separated iodine from gadolinium [1]. Bias was not fixed, though. Raising concentration from 1 to 5 mg/mL cut bias by up to 0.9 mg/mL for iodine and 0.3 mg/mL for gadolinium in pure solutions, and dose, concentration, and solution type all affected bias at a statistically significant level (p<0.0004) [1].
Detectability followed a similarly orderly pattern. CNR peaked at 13 for iodine and 16 for gadolinium at the highest dose and concentration tested, scaling almost perfectly with concentration (R² > 0.99) and less tightly with dose (R² = 0.85 to 0.94) [1]. Mixed solutions told a slightly different story. CNR gained less per unit dose than pure solutions of the same concentration did, for example 0.5 per mGy in a mixture versus 0.6 per mGy in a matched pure gadolinium solution, meaning co-located materials proved somewhat harder to pull apart than materials scanned alone [1]. Image noise itself tracked dose only, not concentration or solution type [1].
The authors also compared their bias figures, 0.5 to 0.7 mg/mL for iodine and 0.3 to 0.7 mg/mL for gadolinium, favorably against a prior preclinical PCCT study’s figures of 0.75 mg/mL and 0.45 mg/mL, achieved at lower dose [1].
Reading the fine print
Three things:
First, this is a preprint. The manuscript is posted on medRxiv and, as of this writing, has not completed peer review [1].
Second, it is phantom-only. Static syringes in a plastic chest tell us a great deal about decomposition physics and very little about blood flow, motion, or real anatomical background, all of which complicate quantification in a living body.
Third, several co-authors are Siemens Healthineers employees or hold a Siemens Healthineers research agreement, and Siemens Healthineers helped fund the work, alongside NIH support [1].
What this means for physicists and imaging scientists
For readers doing protocol or algorithm work, this preprint is a useful bench-top data point. It shows how one commercial multi-material decomposition algorithm behaves for iodine and gadolinium separation, across a defined dose and concentration range, on a scanner already in clinical service [1].
It does not show that K-edge-based dual-contrast imaging is ready for routine clinical material quantification, and it says nothing about diagnostic benefit in any patient population. The open questions the authors themselves raise are the right ones to track: whether accuracy holds in living tissue with blood flow and motion, whether the results replicate on other PCCT vendors and energy-threshold configurations, and whether peer review will ask for an independent reference standard the current design lacks.
FAQ
What is a K-edge, in plain terms?
It is the specific X-ray energy at which an element’s absorption jumps sharply, because photons at that energy can finally eject the element’s innermost electrons. Each element has its own K-edge energy, which is what makes K-edge-based material identification possible.
Was this tested on patients?
No. The study scanned syringes of contrast solution inside a plastic thoracic phantom. No patients or animals were imaged [1].
Why is separating mixed iodine and gadolinium harder than separating them when pure?
When both materials sit in the same location, their spectral signals overlap more, which reduced the contrast-to-noise ratio for mixed solutions compared to pure solutions of the same concentration in this study [1].

I shall keep counting syringes, thresholds, and citations until the peer reviewers finish their own count. Until then, dear colleagues, mind your dose and your priors.
Sign up for The Photon Count newsletter for more nights like this one, spent reading the fine print so you do not have to squint at it alone.
Educational content, not medical advice. Count Photon explains imaging technology and published research for educational purposes. Nothing here is medical advice, and it should never replace a conversation with a qualified healthcare professional about your own care.
References
1. Rybertt et al., “K-Edge Imaging Using a Clinical Dual-Source Photon-Counting CT System.” medRxiv preprint. Posted 2025-08-24 (not peer-reviewed).