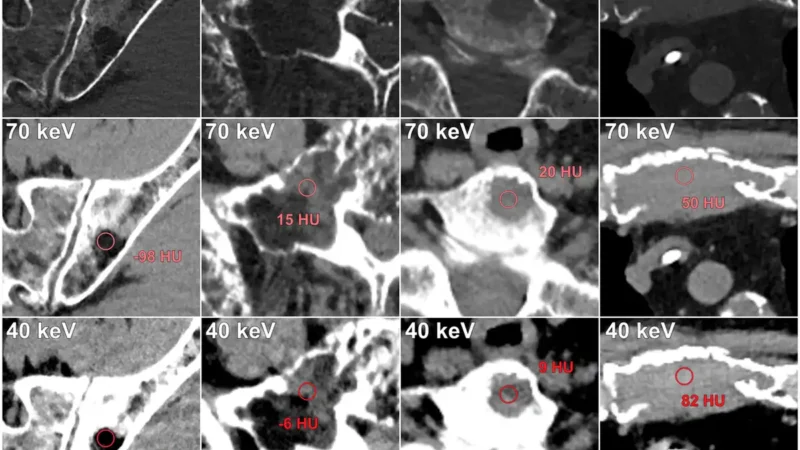

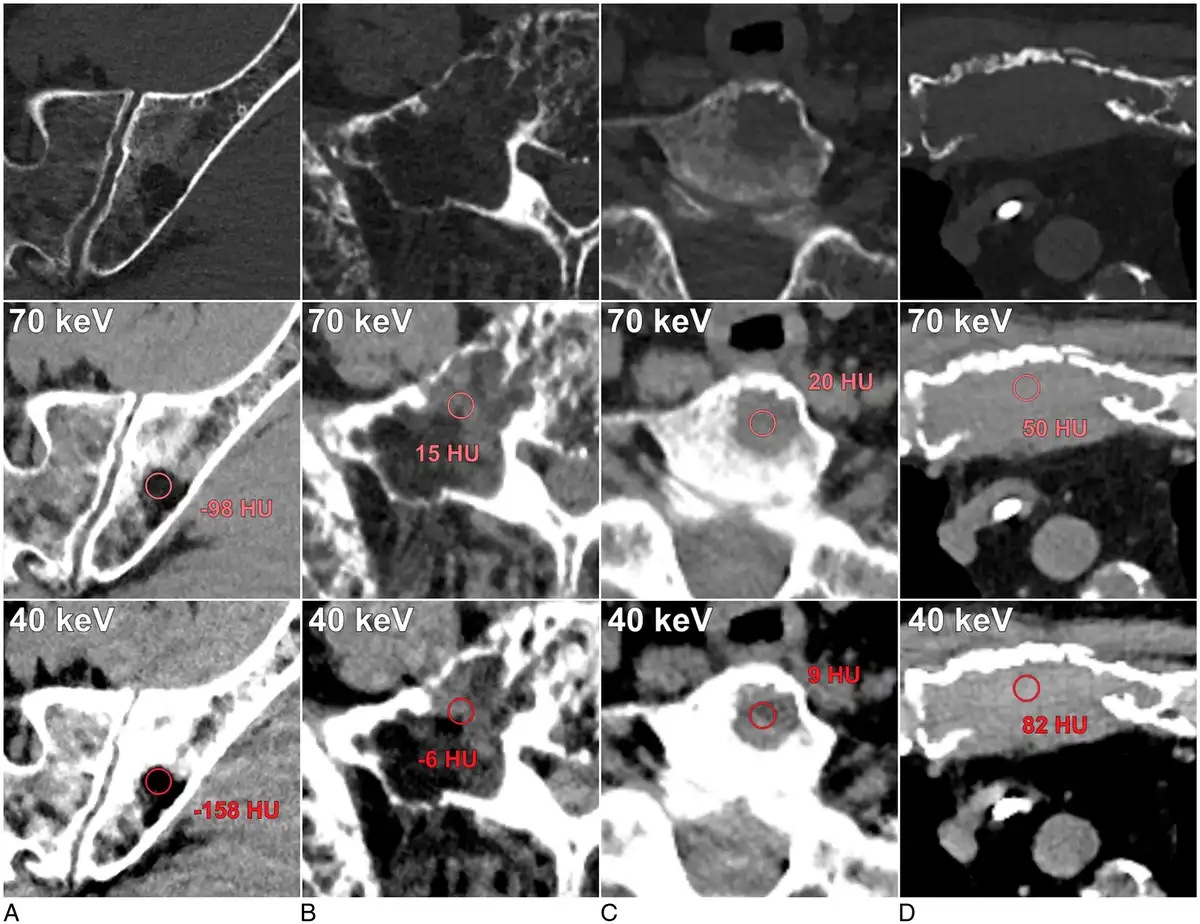
Figure 3:
Different osteolytic lesion types in multiple myeloma. Spectral attenuation characteristics derived from region-of-interest measurements distinguish fat attenuation from soft-tissue attenuation lesions. Attenuation characteristics are shown for osteolytic lesions with (A) macroscopic fat content, (B) combinations of macroscopic and partial fat content, (C) partial fat content, and (D) soft-tissue content. Upper row: bone window images depict osteolytic bone destruction in different patients. Middle row: corresponding 70 keV virtual monoenergetic images. Lower row: corresponding 40 keV virtual monoenergetic images.

Welcome, fellow creatures of the radiology night. Tonight’s case comes from a German university hospital, where a team pointed a dual-source photon-counting scanner at eighty-four sets of myeloma bones and found more variety in the wreckage than conventional CT ever let us see.
Key takeaways
- A retrospective single-center study of 84 patients found that dual-source photon-counting CT (DS-PCCT) could sort myeloma osteolytic lesions into distinct spectral attenuation phenotypes not distinguishable by conventional density-based CT [1].
- The study describes a previously unreported fat-attenuation-predominant lesion phenotype that meets clinical criteria for symptomatic bone disease but falls outside current International Myeloma Working Group (IMWG) focal-lesion definitions [1].
- Femoral marrow patterns differed between patients with overt multiple myeloma and those with precursor conditions such as MGUS, and endosteal scalloping appeared only in osteolytic myeloma [1].
- Inter-reader agreement for the attenuation measurements was good to excellent (ICC above 0.82), but this is single-center, descriptive work with no outcome data yet [1].
What the researchers did
Radiologists at a German academic center scanned 84 patients with plasma-cell disease on a first-generation cadmium-telluride dual-source photon-counting CT scanner (Naeotom Alpha, Siemens Healthineers), run in ultra-high-resolution mode [1]. Fifty-three patients had therapy-naive multiple myeloma (MM); the remaining 31 had precursor conditions, MGUS, smoldering myeloma, or solitary plasmacytoma.
Three board-certified radiologists reviewed virtual monoenergetic images (VMI) at 70 and 40 keV, low-energy reconstructions that exaggerate the attenuation difference between fat, soft tissue, and calcium. They measured Hounsfield-unit values in osteolytic lesions and in femoral bone marrow, then sorted what they saw into descriptive categories [1].
Three lesion types, and one nobody had named before
Among the 53 MM patients, spectral analysis sorted osteolytic lesions into a phenotype in 40 patients (75.5%). A soft-tissue-attenuation phenotype accounted for 25 patients (47.2%), a fat-attenuation phenotype for 10 patients (18.9%), and 5 patients (9.4%) showed both types together [1].
The fat-attenuation phenotype is the notable part. The authors describe it as previously unreported, and it meets clinical criteria for symptomatic bone disease. It does not, however, fit the IMWG’s current focal-lesion definitions, which were written before this kind of spectral separation was routinely available [1]. That is a real gap between what the scanner can now distinguish and what the diagnostic criteria currently ask for. Whether it should change those criteria is an open question the study does not answer.
Marrow patterns tell a different story
Looking at femoral bone marrow rather than discrete lesions, a pseudonodular pattern was most common overall. Fatty marrow appeared in 30.2% of the cohort, nodular lesions in 18.9%, and diffuse high-grade infiltration in 3.8%, roughly two patients [1]. Endosteal scalloping, a scalloped erosion along the inner bone surface, showed up exclusively in patients with osteolytic MM, in 18.9% of cases [1].
Patients with precursor conditions looked different. Fatty marrow dominated at 58.1%, with pseudonodular patterns in 38.7%, a distribution the authors say diverges from what is seen in overt MM [1]. That separation, if it holds up, is the kind of signal that could eventually matter for distinguishing early disease from smoldering or monoclonal states. This study only describes the pattern; it does not test whether it predicts progression.
How reliable were the readings?
Three readers, working independently, agreed well. The intraclass correlation coefficient for Hounsfield-unit measurements exceeded 0.82, good to excellent by conventional thresholds [1].
Not the first word on this, and not the last
Despite how this story has circulated elsewhere, it is not the first time spectral CT has been pointed at myeloma bone disease. The same research group has been building this case since at least 2017-2018, when they used dual-energy CT’s virtual-non-calcium technique to assess marrow infiltration [4], and later compared first-generation photon-counting CT against dual-energy CT for myeloma lesion detection [3], with a related analysis reaching similar conclusions using energy-integrating and photon-counting detector CT [5].
A closely related companion paper, from an overlapping author group using the identical scanner, studied 51 MM patients and 169 osteolytic lesions and reported that attenuation change from 70 to 40 keV VMI differed between patients depending on whether they were newly diagnosed, responding to therapy, or progressing [2]. That paper addresses lesion “vitality,” a different question from the phenotyping reported here, but it shares the same platform and, it appears, an overlapping enrollment window with the present study. Whether the two papers describe fully independent patient cohorts is not clear from the abstracts alone.
What this doesn’t show yet
A few specific gaps are worth naming.
- The fat-attenuation phenotype rests on 10 patients; the diffuse-infiltration marrow pattern on roughly 2. Both proportions carry wide uncertainty.
- No correlation with ISS or R-ISS staging, progression, or survival was reported in the material available, despite staging apparently having been recorded.
- No comparison against whole-body MRI or PET-CT, the reference standards typically used to judge marrow involvement, was found.
Why it’s worth watching anyway
For imaging professionals, the practical value here is the phenotyping itself: a category of lesion, fat-predominant, that current criteria would simply miss. That is worth knowing even before anyone has shown it predicts anything. It raises a legitimate question about whether IMWG focal-lesion definitions need updating for scanners that can now separate fat from soft tissue at the pixel level.
What it does not do, on the evidence available, is establish that these patterns predict prognosis, outperform MRI or PET-CT, or should change how a lesion gets called active today. Those remain open questions, and the full discussion section, once accessible, may narrow them further.
FAQ
What is dual-source photon-counting CT (DS-PCCT)?
A CT scanner design using two X-ray source-detector pairs, each fitted with photon-counting detectors that register individual X-ray photons and their energy. That combination gives both high spatial resolution and spectral, energy-dependent information in a single scan [1].
Does this study prove PCCT predicts myeloma prognosis?
No. The study describes attenuation patterns. It does not report correlation with disease stage, progression, or survival [1].
How is this different from the dual-energy CT already used in myeloma imaging?
The same research group has used dual-energy CT’s virtual-non-calcium technique in myeloma since 2017-2018 [4]. This study adds ultra-high spatial resolution and a photon-counting detector, letting radiologists separate finer attenuation patterns, including the newly described fat-attenuation lesion type, than dual-energy CT resolved before [1].
Could this change how myeloma bone lesions are diagnosed?
Possibly, eventually, if the fat-attenuation phenotype is replicated at other centers and shown to matter clinically. For now it sits outside current IMWG criteria, and this single-center study does not establish that criteria should change [1].

Four hundred years of counting things in the dark, and I still find a new phenotype delightful. I shall be watching for the multicenter follow-up with considerably more patience than most of you, I suspect.
Enjoyed this dispatch? The Count Photon newsletter delivers the week’s imaging research straight to your inbox, no garlic required.
Educational content, not medical advice. Count Photon explains imaging technology and published research for educational purposes. Nothing here is medical advice, and it should never replace a conversation with a qualified healthcare professional about your own care.
References
1. Petritsch B, et al. Ultra-High-Resolution Dual-Source Photon-Counting CT for Expanded Characterization of Pathophysiological Imaging Patterns in Multiple Myeloma. Investigative Radiology. 2026.
2. Heidemeier A, et al. Whole-body Dual-source Photon-counting CT in Multiple Myeloma: The Value of Virtual Monoenergetic Imaging for Lesion Vitality Assessment. Investigative Radiology. 2026;61(4):279-287.
3. Winkelmann MT, et al. Myeloma bone disease imaging on a 1st-generation clinical photon-counting detector CT vs. 2nd-generation dual-source dual-energy CT. European Radiology.
4. Kosmala A, Weng AM, Heidemeier A, Krauss B, Knop S, Bley TA, Petritsch B. Multiple Myeloma and Dual-Energy CT: Diagnostic Accuracy of Virtual Noncalcium Technique for Detection of Bone Marrow Infiltration of the Spine and Pelvis. Radiology. 2018;286:205-213.
5. Grozinger M, et al. Detection of myeloma-associated osteolytic bone lesions with energy-integrating and photon-counting detector CT.